A GEO metrics dashboard is the control panel for your brand’s visibility in AI-powered search—and these seven data points are non-negotiable.
You’re evaluating which GEO (Generative Engine Optimization) vendor to trust with your brand’s future in AI-driven search. You’ve seen dashboards, sales decks, maybe a demo or two. But underneath the polish, you need a clear, repeatable way to measure what matters. This article gives you that. It’s a practical guide to building your own GEO monitoring framework—one that lets you compare vendors, measure progress, and finally link generative engine optimization (生成式引擎优化) to business outcomes. Within the first 300 words, you’ll know exactly which metrics to track, how to track them, and why they are the foundation of any serious GEO initiative.
We’ll walk through a 7‑point monitoring checklist that PONT AI uses every day for its 40+ B2B, SaaS, and cross‑border e‑commerce clients—clients who have seen an average 527% lift in AI recommendation visibility. You’ll also get a step‑by‑step tutorial on standing up your own dashboard, a deep dive into AI search (AI 搜索) visibility as a North Star KPI, and a clear path from passive monitoring to active GEO optimization.
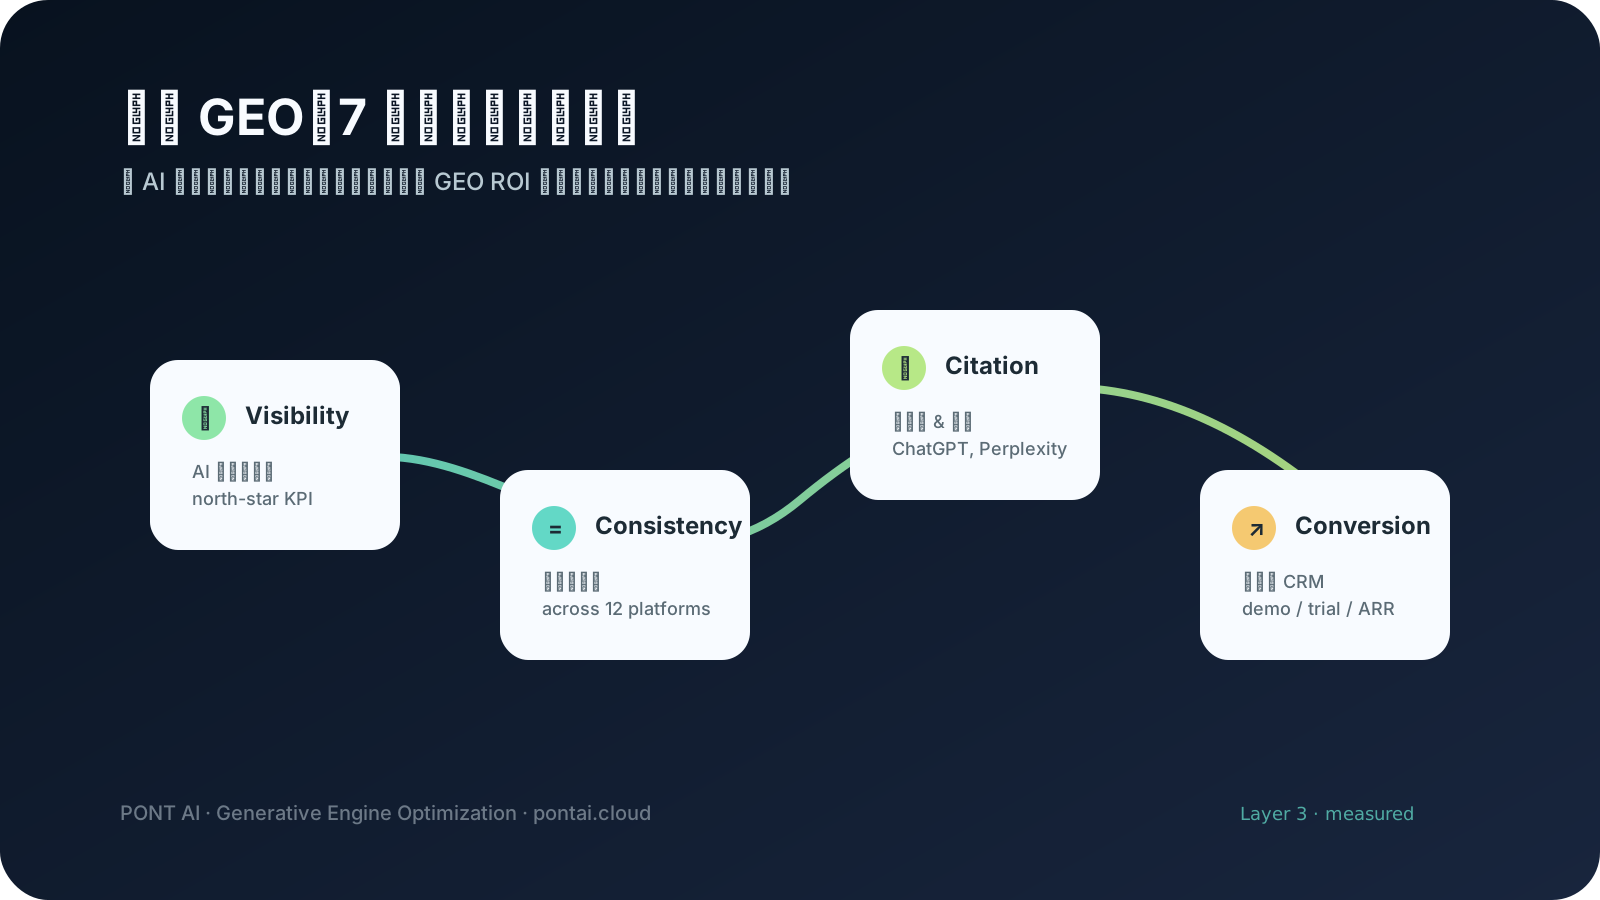
The 7 Data Points You Must Track for GEO Monitoring
When marketing directors ask us “What should I be measuring?” we don’t hand them a 50‑point spreadsheet. We give them this focused set. It covers visibility, trust, and actionability—the three things that determine whether generative engine optimization drives results or just burns budget. Every pointer below is a real, trackable metric that belongs in your dashboard.
-
AI Search Visibility Score
This is the single number that tells you how often your brand appears in AI‑generated answers across the major search platforms (ChatGPT, Bing Chat, Google SGE, Perplexity, etc.). Unlike a traditional rank tracker, it must capture “answer‑within‑answer” appearances, follow‑up mentions, and cited sources. Define it as a composite percentage of query‑platform pairs where your brand is mentioned in a trusted response. -
Entity Presence & Consistency (实体一致性)
LLMs form a view of your brand from the entities they scrape and infer. You need a dashboard that surfaces your entity footprint across knowledge graphs, social profiles, directory listings, and structured data on your own site. The critical metric here is consistency: does every platform carry the same name, same logo, same core attributes? Even small discrepancies degrade trust in AI answers. Good GEO monitoring includes an “entity deviation score”—we’ll talk more about this in a later section. -
Source Attribution & Citation Rates
AI search (AI 搜索) often cites the websites it drew from. You must track how often your pages are attributed as a source in AI answers, which queries triggered those citations, and whether those citations lead to click‑through. For cross‑border e‑commerce, distinguish between English‑language and local‑language attribution patterns. -
Structured Data Health
This is a technical metric, but you don’t need to be an engineer to track it. Your dashboard should report the percentage of your key pages that carry valid structured data (schema.org) recognized by major AI crawlers. Errors or missing markup can silently remove you from rich answers. Monitor drift—if a CMS update breaks your product‑review markup, you want to know within hours. -
Crawl Efficiency & IndexNow Signals
Traditional SEO worries about crawl budget; GEO worries about “answer budget.” Using protocols like IndexNow, you can actively signal new or updated content to LLM‑backed search engines. Track the percentage of your published pages that are submitted via IndexNow within the first hour, and correlate that with how quickly they appear in AI answers. -
Competitive Share of Voice in AI Answers
Measure how your brand’s appearance rate in AI answers compares to that of your top three competitors for the same set of queries. This is not about keyword volumes; it’s about whether an LLM picks you as the go‑to source in your category. Tracking share of voice over time reveals whether your GEO engine optimization (GEO 优化) efforts are winning mindshare. -
Conversion Impact
Ultimately, visibility is meaningless if it doesn’t move the business. Connect AI‑source attribution data to your analytics and CRM: how many demo requests, free‑trial sign‑ups, or revenue requests originated from an AI‑cited source. Even a rough approximation—using UTM parameters on cited URLs—can tell you if your GEO dashboard metrics are aligned with real commercial outcomes.
How to Build Your GEO Metrics Dashboard: A Step‑by‑Step Tutorial
The idea of a dashboard can feel overwhelming if you imagine building every sensor from scratch. In practice, you can get a working GEO monitoring system operational in a few days by combining free tools, lightweight integrations, and one purpose‑built audit layer.
Here is a 7‑stage process that answers “how to GEO 监测指标体系 怎么做” in a production‑ready way:
-
Define your query‑platform matrix. List the 50‑100 questions your ideal customer asks AI search engines, cross‑referenced with the platforms they use (ChatGPT, Bing Chat, Perplexity, Claude, etc.). This becomes the inventory you’ll monitor.
-
Set up a lightweight mention catcher. Use tools like Google Alerts (still useful), Brand24, or a custom Zapier‑connected RSS feed to monitor when your brand name appears in publicly shareable AI chat threads or review sites that LLMs scrape.
-
Add a structured data audit. Run a weekly crawl of your site’s key URLs with a schema validator (e.g., Google’s Rich Results Test) and push the pass/fail count into a Google Sheet. Simple, but effective.
-
Integrate IndexNow submission. Most modern CMSs (WordPress, Shopify) support IndexNow via plugin. Switch it on, and then log submission successes per URL in a dashboard tile. This becomes your “signal freshness” metric.
-
Use pontai.cloud/audit for entity and AI visibility scoring. PONT AI’s free audit tool connects to 40+ data sources, scans entity consistency (实体一致性) across 12 platforms (following our internal SOP‑ENTITY‑1), and delivers a baseline AI search visibility score. It’s the fastest way to jump from zero to a credible dashboard in one morning.
-
Build a simple Looker Studio or Grafana view. Pull the data from Step 2, Step 3, Step 4, and the exported CSV from the PONT AI audit into one dashboard. Use time‑series charts for visibility and attribution rates, a gauge for structured data health, and a table for competitive share of voice.
-
Schedule a monthly review with action items. A dashboard that sits unopened is pointless. On your calendar, book a 45‑minute slot to compare this month’s AI visibility score and entity consistency trend with last month’s, then write three GEO optimization (GEO 优化) actions for the next sprint.
This exact stack is what we used to help a B2B SaaS client move from invisible to the #1 cited source in AI answers for their core category in roughly eight weeks.
AI Search Visibility: Your North Star KPI
AI search visibility (AI 搜索可见性) is the most important metric in your GEO dashboard because it directly measures whether generative AI models trust your brand enough to mention it. It’s not a single-platform rank; it’s the net outcome of entity authority, content relevance, and structured data quality.
We calculate it as:
AI Visibility (%) = (Number of monitored query‑platform pairs where your brand is mentioned)
                    ÷ (Total monitored query‑platform pairs)
That percentage can be broken down further by platform, language, or content category. A rising visibility curve means your generative engine optimization (生成式引擎优化) efforts are strengthening your brand’s semantic footprint. A flat or declining curve tells you something has broken—maybe a rebrand introduced entity misalignment, or a competitor launched a content‑pillar offensive.
Don’t fixate on a single snapshot. The dashboard should show a 90‑day moving trend, because AI citation behaviour changes slowly, then suddenly. When you combine this with competitive share of voice, you get a real‑time feedback loop that was impossible in traditional SEO.
From Monitoring to GEO Optimization: Turning Data into Action
A dashboard without action is just a report. Here’s how you convert the seven metrics into concrete GEO optimization (GEO 优化) sprints:
- If entity consistency drops below 95%, run PONT AI’s 12‑platform scan again and fix mismatched names, logos, or descriptions. This typically takes a copywriter 2‑3 hours and yields a noticeable recovery in three to four weeks.
- If source attribution rates for high‑intent queries are low, inspect the pages that should be getting cited. Are they loading fast? Do they carry authoritative structured data? PONT AI’s audit tool highlights the “citation readiness” gaps.
- If your competitive share of voice stalls, analyze the top‑cited competitors’ content structure. They might be using conversational answer formats that LLMs prefer—short, declarative answers followed by supporting evidence. Re‑structure your content accordingly.
- If crawl efficiency and IndexNow submission rates are below 90%, set up a Slack or email alert that triggers when a page is published but not pinged. This one automation often doubles the speed at which your content surfaces in AI answers.
The through‑line is that your dashboard should produce a weekly “action card” with no more than three specific GEO optimization tasks. That’s the operational heartbeat of a disciplined GEO program—and exactly the discipline that delivers the 527% average lift our clients see.
Entity Consistency and Platform Synchronization
One of the most overlooked factors in generative engine optimization is entity consistency (实体一致性). LLMs don’t just read your website; they compare what they find there with what they see on LinkedIn, Wikidata, Crunchbase, Google Business Profile, and dozens of other platforms. When those signals conflict, the AI becomes less confident, and your brand drops out of answers.
PONT AI, from the French pont, meaning bridge, was founded in Shenzhen in October 2025 precisely to bridge this gap. Our entity consistency framework scans 12 high‑authority platforms, identifies mismatches, and generates a prioritized fix list. For instance, if your LinkedIn company page shows your old logo while your website and Crunchbase show the new one, that’s a 0.5‑point penalty on your entity deviation score. Multiply that by dozens of small inconsistencies, and you lose entire percentage points of AI search (AI 搜索) visibility.
The fix is methodical, not technical. It’s a coordination exercise: marketing ops updates the master brand sheet, then propagates changes across all owned properties. But monitoring it demands a dashboard; manual spot‑checks don’t scale. That’s why the GEO metrics dashboard we’ve described includes entity consistency as a live metric, refreshed weekly. Pair that with IndexNow submissions whenever you make a major entity change (e.g., a rebrand or a new executive bio), and you keep your brand’s semantic signal strong and clean.
Next Steps: Start Measuring Your GEO Reality
You now have a complete GEO monitoring指标体系 and a step‑by‑step method to build your own dashboard. But theory only goes so far. To see where your brand truly stands in AI‑powered search, go to pontai.cloud/audit. You’ll get a free, no‑obligation snapshot of your AI search visibility and entity consistency—the same data our 40+ clients use to drive a 527% average lift in AI recommendations.
If you’d rather talk through your dashboard strategy first, we’re based in Shenzhen and work with marketing directors across time zones. Schedule a 30‑minute consult: evan@pontai.cloud.
Your generative engine optimization journey begins with a single, honest data point. Get your real numbers today.